Collecting Data for AP Statistics
Overview
This lesson will prepare students for their AP Statistics Inference PBL (project-based learning) unit during the fourth and largest topic in the AP Statistics standards, inference. For this assignment, students will be collecting data on various topics of their choosing. One concern is that student perception seems to blur raw data and statistics. This lesson will help to clarify the differences as well as help students collect data and choose a final topic for their inference PBL. For the future PBL, students will use this data to determine if there is significant difference between what is claimed to be true and what the data actually says.
Time Frame
1-3 class periods - This depends on how much time the instructor needs to use given class time or can assign work outside of class. Some instructors may need more class time depending on whether the student population has access to the internet outside of school.
Objectives
SWBAT distinguish between raw data and statistics.
SWBAT determine if the data they collect is a census, a sample survey, an experiment or an observational study.
SWBAT identity the population and the sample in a sample survey (Starnes, 2011)
SWBAT distinguish an SRS (simple random sample) from a stratified random sample or cluster sample (Starnes, 2011)
SWBAT utilize various random sampling techniques such as a random number generator on a website, a spreadsheet, a table, or a calculator.
SWBAT communicate with other classmates and their project partner using primary pad, Google spreadsheets and Google Presentations.
SWBAT search for corporations and data on the internet using a multitude of techniques including but not limited to Google search, twitter and Facebook.
SWBAT communicate with corporations via Skype, twitter, Facebook, email and phone conversations.
College Board Standards for AP Statistics
II . Sampling and Experimentation: Planning and conducting a study (10%–15%)
Data must be collected according to a well-developed plan if valid information on a conjecture is to be obtained. This plan includes clarifying the question and deciding upon a method of data collection and analysis.
A . Overview of methods of data collection
1 . Census
2 . Sample survey
3 . Experiment
4 . Observational study
B . Planning and conducting surveys
1 . Characteristics of a well-designed and well-conducted survey
2 . Populations, samples and random selection
3 . Sources of bias in sampling and surveys
4 . Sampling methods, including simple random sampling, stratified random sampling and cluster sampling
C . Planning and conducting experiments
1 . Characteristics of a well-designed and well-conducted experiment
2 . Treatments, control groups, experimental units, random assignments and replication
3 . Sources of bias and confounding, including placebo effect and blinding
4 . Completely randomized design
5 . Randomized block design, including matched pairs design
D . Generalizability of results and types of conclusions that can be drawn from observational studies, experiments and surveys
Social Networking Tools and Other Tools Required
A computer with internet connection for each student
Skype
Twitter
Facebook
Primary Pad
Various Search Engines, Google Search, Bing, Yahoo, etc
Google Presentations
Google Spreadsheet
This lesson will prepare students for their AP Statistics Inference PBL (project-based learning) unit during the fourth and largest topic in the AP Statistics standards, inference. For this assignment, students will be collecting data on various topics of their choosing. One concern is that student perception seems to blur raw data and statistics. This lesson will help to clarify the differences as well as help students collect data and choose a final topic for their inference PBL. For the future PBL, students will use this data to determine if there is significant difference between what is claimed to be true and what the data actually says.
Time Frame
1-3 class periods - This depends on how much time the instructor needs to use given class time or can assign work outside of class. Some instructors may need more class time depending on whether the student population has access to the internet outside of school.
Objectives
SWBAT distinguish between raw data and statistics.
SWBAT determine if the data they collect is a census, a sample survey, an experiment or an observational study.
SWBAT identity the population and the sample in a sample survey (Starnes, 2011)
SWBAT distinguish an SRS (simple random sample) from a stratified random sample or cluster sample (Starnes, 2011)
SWBAT utilize various random sampling techniques such as a random number generator on a website, a spreadsheet, a table, or a calculator.
SWBAT communicate with other classmates and their project partner using primary pad, Google spreadsheets and Google Presentations.
SWBAT search for corporations and data on the internet using a multitude of techniques including but not limited to Google search, twitter and Facebook.
SWBAT communicate with corporations via Skype, twitter, Facebook, email and phone conversations.
College Board Standards for AP Statistics
II . Sampling and Experimentation: Planning and conducting a study (10%–15%)
Data must be collected according to a well-developed plan if valid information on a conjecture is to be obtained. This plan includes clarifying the question and deciding upon a method of data collection and analysis.
A . Overview of methods of data collection
1 . Census
2 . Sample survey
3 . Experiment
4 . Observational study
B . Planning and conducting surveys
1 . Characteristics of a well-designed and well-conducted survey
2 . Populations, samples and random selection
3 . Sources of bias in sampling and surveys
4 . Sampling methods, including simple random sampling, stratified random sampling and cluster sampling
C . Planning and conducting experiments
1 . Characteristics of a well-designed and well-conducted experiment
2 . Treatments, control groups, experimental units, random assignments and replication
3 . Sources of bias and confounding, including placebo effect and blinding
4 . Completely randomized design
5 . Randomized block design, including matched pairs design
D . Generalizability of results and types of conclusions that can be drawn from observational studies, experiments and surveys
Social Networking Tools and Other Tools Required
A computer with internet connection for each student
Skype
Primary Pad
Various Search Engines, Google Search, Bing, Yahoo, etc
Google Presentations
Google Spreadsheet
Description of Lesson
Students should choose a partner to work with for this activity. Students should have their own computer throughout this activity.
Students should choose a partner to work with for this activity. Students should have their own computer throughout this activity.
|
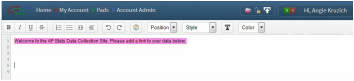
Phase I - Using Primary Pad
1. Students search for data posted by corporations using their choice of search engine. 2. The instructor will need to set up an account for Primary Pad. 3. When students find raw data (or statistics), they should add the link to primary pad during class. 4. As students enter their findings onto Primary Pad, the instructor can monitor their choices to make sure students are adding links to data, not statistics. 5. Follow this link to an example. The password is apstats. |

|

|
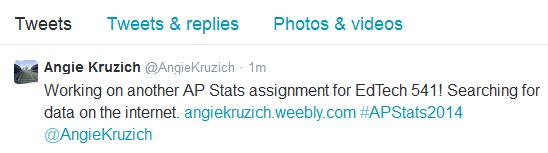
Phase II - Using Twitter
1. Students and their chosen partner determine which set of data they would prefer to investigate further. Alternatively, students may collect their own data using a proper sample collection technique. 2. If the students and the instructor don't already have an account for Twitter, then they will each need to set one up on Twitter. 3. Next, partners will tweet their topic choice onto Twitter using a specified hash tag to sort the class's tweets and an @ symbol with the instructor's account name. This way everyone can locate the info and the instructor will automatically receive the information. An example could be to use #APStats2014 @AngieKruzich. My account is established to see an example. 4. Students need to choose different topics. Just before they enter their topic, they should use the specified class hash tag to make sure no one else has chosen the same topic. |
|
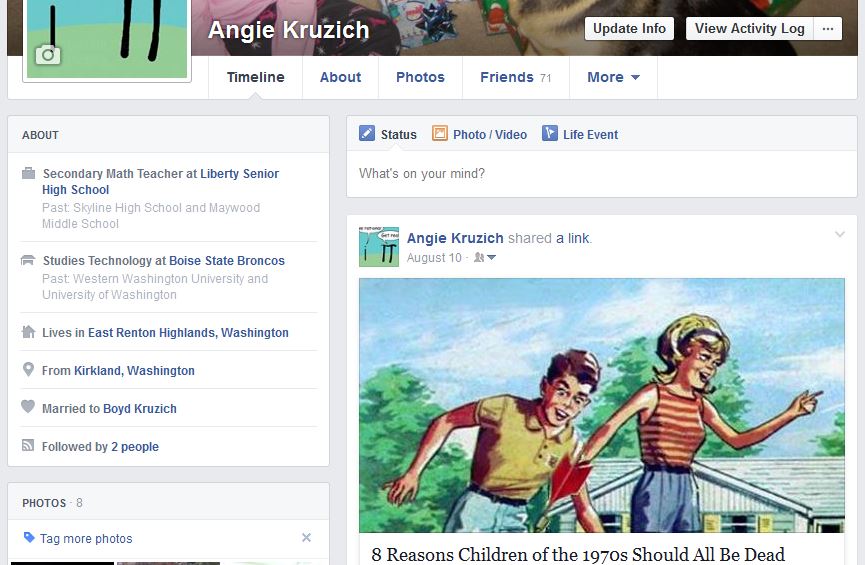
Phase III - Using Facebook and Skype
1. Students determine the corporation claim of this data by contacting the corporation directly. (i.e. What percentage of each color of a candy.) 2. To complete this task, students will need a Facebook account and a Skype account. 3. Contact the corporation using Facebook and Skype. 4. Students should search for their corporation using Facebook and contact them through Facebook. 5. It is suggested that students send an email to set up a time to have a Skype conversation about the data involved. 6. Here is a link to my Facebook account as an example. 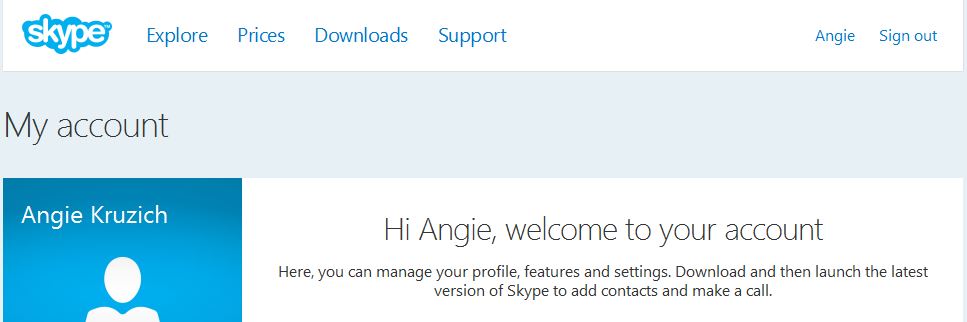
|
|


|
Phase IV - Using Google Drive
1. Next, students should determine the time they will both be available to work together outside of class. (Working in class is also an option.) 2. Students and the instructor will also need a Google account. 3. While working from two distinct locations, partners can progress. To continue from this point, students must have their corporation claim and data ready. 4. Enter the data onto a Google spreadsheet. |
5. Students will begin to create their Google Presentation.
- Create a title slide identifying the project title and student information.
- Enter the background information about their chosen data on a slide.
- Add the corporation claim regarding their chosen data.
- Include each student's own beliefs regarding whether or not the data will support the corporation claim.
- Finally, introduce the data in the presentation by embedding it from the Google Spreadsheet.
Wrap Up
Actual analysis of the data will take place in the next unit of AP Statistics, the inference unit. During the inference unit, students will learn how to analyze the data to determine if there is a significant difference between the corporation claim and what the data presented calculates. When this portion has been completed, students should present their presentations as a team.
Actual analysis of the data will take place in the next unit of AP Statistics, the inference unit. During the inference unit, students will learn how to analyze the data to determine if there is a significant difference between the corporation claim and what the data presented calculates. When this portion has been completed, students should present their presentations as a team.
Sources
References
College Board (2010). AP statistics course description. Retrieved from http://media.collegeboard.com/digitalServices/pdf/ap/ap-statistics-course-description.pdf
Roblyer, M. D. & Doerling, A. H. (2013). Integrating educational technology into teaching (6th ed.). Upper Saddle River, NJ: Pearson.
Starnes, D., Yates, D., & Moore, D. (2011). The practice of statistics. New York, New York: W.H. Freeman and Company.
Photo Credits
Facebook Logo from http://www.vectorsland.com/vector/find-us-on-facebook-logo-89832.html
Google Drive Logo from http://www.northallegheny.org/google
Primary Pad Logo from http://teachmeet.pbworks.com/w/page/39541586/TeachMeetExeter2011
Skype Logo from http://www.geofffox.com/MT/archives/2014/05/19/i-like-skype-more-all-the-time.php
Twitter Logo from http://abcnews.go.com/blogs/technology/2012/11/twitter-asks-users-to-reset-passwords-citing-hacking-issues/
