Part 1: Simulations
Below you will find four tested simulations and a description of each. Also included is how these simulations would work well in AP Statistics courses.
Simulation 1: Gizmos
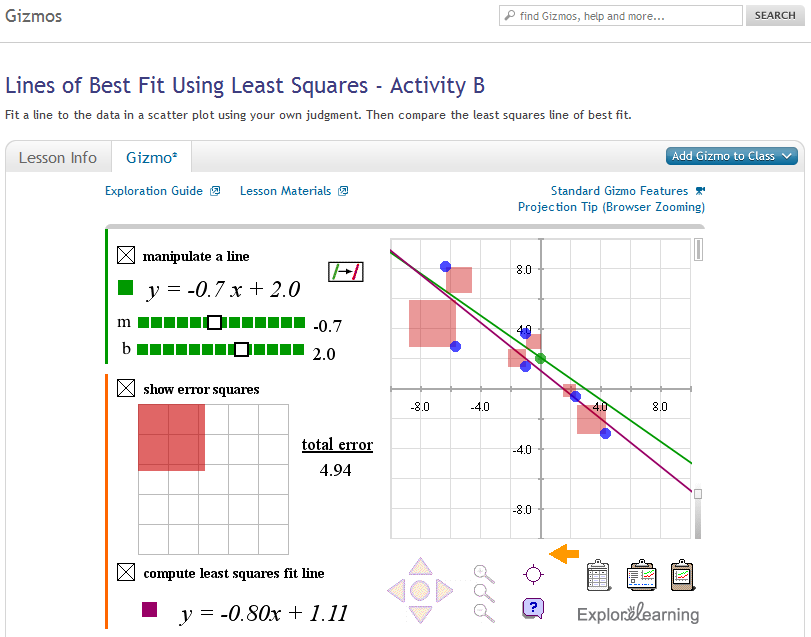
Personal Reaction: This is a fabulous tool to speed up student learning about Least Square Regression Lines (LSRL). Before using this in the classroom, students need to have an understanding of writing equations for lines in slope-intercept form. (y=mx+b)
Ease of Use: Extremely Easy to Use! Middle school through high school aged student would have no issues with the simulation.
Educational Value: High Level Value! This simulation is immediately rewarding as students can assess their lines of best fit by clicking on the actual mathematically calculated LSRL.
Appropriate Age/Course Level: Because Algebra 1 uses the ideas about lines of best fit, students could use this in Algebra 1, Algebra 2 and AP Statistics. Even middle school students sketching lines of best fit without the detailed mathematical explanation would benefit.
AP Statistics Applicability: This simulation is an excellent AP Statistics resource when introducing bi-variate data and LSRL. Students using this simulation can truly experience finding the LSRL for a scatter plot by minimizing the squares of the residuals. Once students have a line that they think minimizes the squares the best, the student can click the box to have the simulation identify the mathematically calculated Least Squares Regression Line. There are many more simulations available on Gizmos that also align to the Common Core State Standards!!
Simulation 2: EdHeads
Personal Reaction
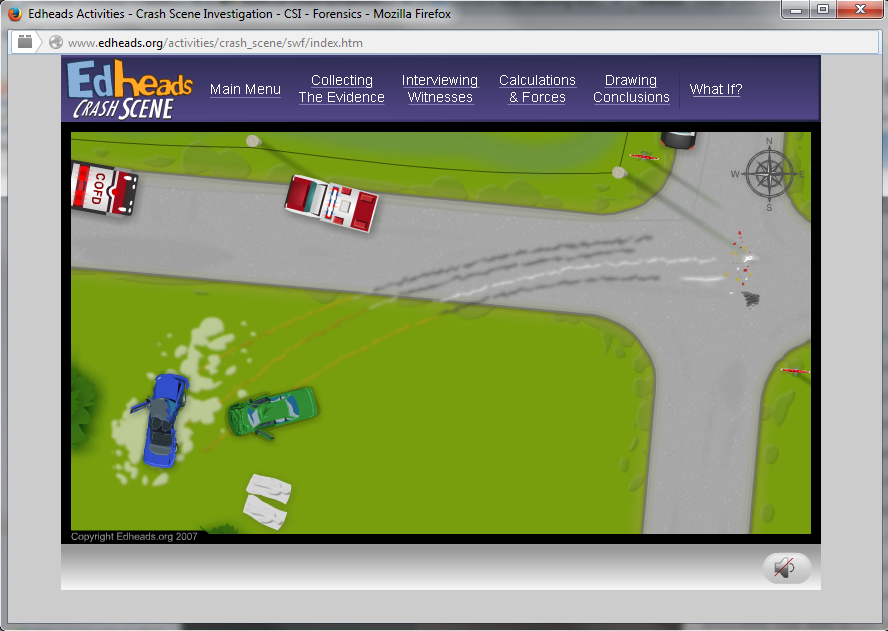
Like Gizmos, this is also free simulation software. Crash Scene Investigation was the simulation reviewed. Students are introduced to a simulated crash site. I was immediately drawn into the activity and wanted to complete every single step to see how to analyze a car crash. Students would also be quickly drawn in based on the introduction. There are also lots of spots where the simulation pauses. This will be great to allow students to discuss and record their findings as they proceed.
Ease of Use
Extremely Easy to Use! High school aged students would have no issues with the simulation.
Educational Value
In Crash Scene Investigation, students are provided with a worksheet to print and then to document their findings as they proceed through the simulation. This is a simulation where the outcome will change depending on the choices the student makes during the activity. This simulation combines the topics of math, physics, and statistics. Any school now offering a forensics course would also benefit from this simulation. This is real-life and demonstrates how topics, like math and physics, intertwine in real-world scenarios.
Appropriate Age/Course Level
The Crash Scene Investigation simulation would be an excellent tool for any students age 15-16, as they learn how to drive, as there is a lot of realism about the severity of a car crash. I am not sure it would be age appropriate for middle school students or younger because of the nature of the topic and the discussion that occurs during the simulation. In general, ninth through twelve grade could use this simulation.
AP Statistics Applicability
AP Statistics would be able to experience a real-life data collection process. Data is collected in this manner regularly by crash scene investigators which is then used to analyze future crash scenes. This is also what AP Statistics students need to do; collect data, analyze data, then make conclusions based on their analysis.
Personal Reaction
Like Gizmos, this is also free simulation software. Crash Scene Investigation was the simulation reviewed. Students are introduced to a simulated crash site. I was immediately drawn into the activity and wanted to complete every single step to see how to analyze a car crash. Students would also be quickly drawn in based on the introduction. There are also lots of spots where the simulation pauses. This will be great to allow students to discuss and record their findings as they proceed.
Ease of Use
Extremely Easy to Use! High school aged students would have no issues with the simulation.
Educational Value
In Crash Scene Investigation, students are provided with a worksheet to print and then to document their findings as they proceed through the simulation. This is a simulation where the outcome will change depending on the choices the student makes during the activity. This simulation combines the topics of math, physics, and statistics. Any school now offering a forensics course would also benefit from this simulation. This is real-life and demonstrates how topics, like math and physics, intertwine in real-world scenarios.
Appropriate Age/Course Level
The Crash Scene Investigation simulation would be an excellent tool for any students age 15-16, as they learn how to drive, as there is a lot of realism about the severity of a car crash. I am not sure it would be age appropriate for middle school students or younger because of the nature of the topic and the discussion that occurs during the simulation. In general, ninth through twelve grade could use this simulation.
AP Statistics Applicability
AP Statistics would be able to experience a real-life data collection process. Data is collected in this manner regularly by crash scene investigators which is then used to analyze future crash scenes. This is also what AP Statistics students need to do; collect data, analyze data, then make conclusions based on their analysis.
Simulation 3: CK-12 Simulations
Personal Reaction
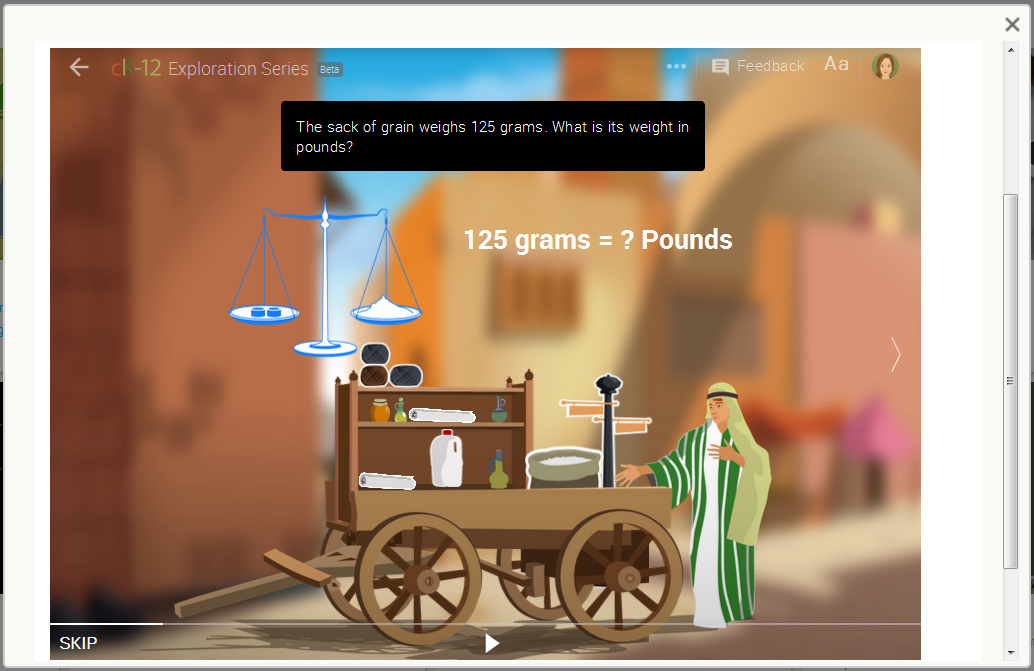
The simulation review on the CK-12 website is called Unit Conversions. At first I was very excited to experience another simulation. However, I would say this is not a simulation but more of a tutorial session. There appears to be no student and website interaction. The students read and watch a bit of motion. It would have been better if there were some sound. The answers fade in and out automatically with the questions so there is no opportunity for students to try without seeing the answer. I can see a non-motivated student just skimming this over and not absorbing much of the data.
Ease of Use
Medium-to-Hard Ease of Use. The student will Read, Watch, Then Write, but it is unclear which buttons to press during the Unit Conversions simulation if any at all. An arrow is usually an indicator of what to do. However, when you press it you jump straight to the end. It took a while, but finally I figured out you stay on the first screen and the simulation progresses automatically with a fade in and out option. However the fades are so slow, if you don't wait long enough then you don't realize you are already in the simulation. Again, sound would have made the process much more clear.
Educational Value
This simulation helps students learn about making conversions between the Metric system and the English system. It begins with a written explanation and an example on how to convert units. In an attempt to make it more interesting, the simulation implies that students will negotiate with a trader at the crossroads. However, there is no interesting interaction. A highly motivated student will take the opportunity to do the problems and learn from the simulation.
Appropriate Age/Course Level
Middle School through High School...or any student that is learning to convert units.
AP Statistics Applicability
In AP Statistics, students study the effects that unit conversion has on center and spread in regards to data. Some students need additional assistance with the unit conversion process. This simulation would be an excellent tool to help a student learn or re-learn how to convert between units. Once they correctly know how to convert the units using addition, multiplication or division, then AP Stats students could figure out the affects of numbers used to describe center and spread.
Personal Reaction
The simulation review on the CK-12 website is called Unit Conversions. At first I was very excited to experience another simulation. However, I would say this is not a simulation but more of a tutorial session. There appears to be no student and website interaction. The students read and watch a bit of motion. It would have been better if there were some sound. The answers fade in and out automatically with the questions so there is no opportunity for students to try without seeing the answer. I can see a non-motivated student just skimming this over and not absorbing much of the data.
Ease of Use
Medium-to-Hard Ease of Use. The student will Read, Watch, Then Write, but it is unclear which buttons to press during the Unit Conversions simulation if any at all. An arrow is usually an indicator of what to do. However, when you press it you jump straight to the end. It took a while, but finally I figured out you stay on the first screen and the simulation progresses automatically with a fade in and out option. However the fades are so slow, if you don't wait long enough then you don't realize you are already in the simulation. Again, sound would have made the process much more clear.
Educational Value
This simulation helps students learn about making conversions between the Metric system and the English system. It begins with a written explanation and an example on how to convert units. In an attempt to make it more interesting, the simulation implies that students will negotiate with a trader at the crossroads. However, there is no interesting interaction. A highly motivated student will take the opportunity to do the problems and learn from the simulation.
Appropriate Age/Course Level
Middle School through High School...or any student that is learning to convert units.
AP Statistics Applicability
In AP Statistics, students study the effects that unit conversion has on center and spread in regards to data. Some students need additional assistance with the unit conversion process. This simulation would be an excellent tool to help a student learn or re-learn how to convert between units. Once they correctly know how to convert the units using addition, multiplication or division, then AP Stats students could figure out the affects of numbers used to describe center and spread.
Simulation 4: National Library of Virtual Manipulatives
Personal Reaction
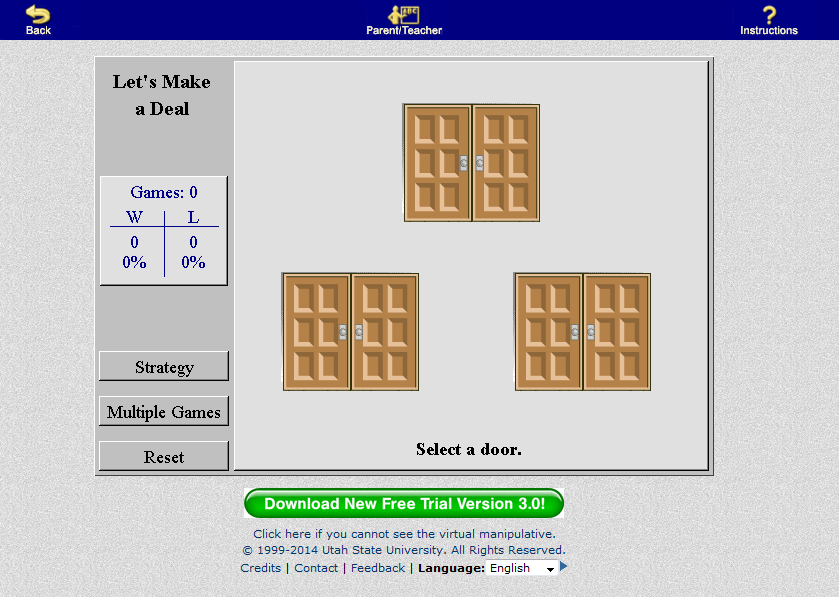
The simulation is called Stick or Switch based on the old game show "Let's Make a Deal". It is an excellent simulation as it allows someone to just play the game or use the simulation to test long-run outcomes. Immediately I enjoyed what the game was trying to accomplish. It is a true simulation as there is plenty of user-website interaction.
Ease of Use
Easy-to-Medium Ease of Use. This one took a few trials to figure out what was supposed to happen, but it did not take that long. Using the Stick or Switch simulation did not happen instantaneously.
Educational Value
This simulation has strong educational value associated with it. This is an example of a Web 2.0 Tool that enhances classroom learning. Instead of students having to run 100 simulations by hand, which takes a huge amount of time, student can run the simulation using the software and finish in seconds. Instead of using time in class to create the simulation (if a teacher does it at all since it is a waste of time), the software can complete the process in seconds. Now class time can be used to help students understand higher cognitive levels of probability rather than spend time collecting this type of data.
Appropriate Age/Course Level
This is a simulation appropriate for grades 4-12. Students just learning basic probability could use Stick or Switch as well as high school students who are investigating more complex probability scenarios.
AP Statistics Applicability
There are high levels of applicability to AP Stats when using the Stick or Switch manipulative. When students are studying The Law of Large Numbers (what happens in the long-run), they could use this simulation to run 100's of probability examples to fully experience The Law of Large Numbers. This simulation could also be used to help students study the Binomial Theorem of probability. Students could run several simulations, documenting the outcome of each, then determine the probability that the outcome would actually occur.
Personal Reaction
The simulation is called Stick or Switch based on the old game show "Let's Make a Deal". It is an excellent simulation as it allows someone to just play the game or use the simulation to test long-run outcomes. Immediately I enjoyed what the game was trying to accomplish. It is a true simulation as there is plenty of user-website interaction.
Ease of Use
Easy-to-Medium Ease of Use. This one took a few trials to figure out what was supposed to happen, but it did not take that long. Using the Stick or Switch simulation did not happen instantaneously.
Educational Value
This simulation has strong educational value associated with it. This is an example of a Web 2.0 Tool that enhances classroom learning. Instead of students having to run 100 simulations by hand, which takes a huge amount of time, student can run the simulation using the software and finish in seconds. Instead of using time in class to create the simulation (if a teacher does it at all since it is a waste of time), the software can complete the process in seconds. Now class time can be used to help students understand higher cognitive levels of probability rather than spend time collecting this type of data.
Appropriate Age/Course Level
This is a simulation appropriate for grades 4-12. Students just learning basic probability could use Stick or Switch as well as high school students who are investigating more complex probability scenarios.
AP Statistics Applicability
There are high levels of applicability to AP Stats when using the Stick or Switch manipulative. When students are studying The Law of Large Numbers (what happens in the long-run), they could use this simulation to run 100's of probability examples to fully experience The Law of Large Numbers. This simulation could also be used to help students study the Binomial Theorem of probability. Students could run several simulations, documenting the outcome of each, then determine the probability that the outcome would actually occur.
Part 2: Resources
Below you will find 20 internet resources that support and enhance the AP Statistics curriculum.
1. GeoGebra - This free online Web 2.0 Tool has both spreadsheet and probability abilities used in AP Statistics. It helps students gain a better understand of the probabilities under a normal density curve and many other higher level statistical curves as well. Students can also use the statistics option to run t-tests, z-tests, goodness-of-fit tests and chi-squares tests!
2. Texas Instruments - Students and teachers can download a free trial of the TI-Nspire Calculator. This calculator is absolutely amazing when it comes to manipulating statistical data. This is also one of the hand-held calculators allowed during the AP exam. It is vital for students to know how to use a hand-held graphing calculator for this course. Students can use the computer software at home and at school.
3. Khan Academy - An amazing tutorial, combined with interaction, website. Students can seek almost any AP Statistics concept on the Khan Academy website to study it further. There are tutorial videos as well as practice problems for students to try on their own.
4. Gizmos - This is free simulation software that covers many of the topics for AP Statistics. Although it does not cover every AP Statistics topic, those it does cover are excellent simulations. AP Stats topics included are boxplots, histograms, describing data, samples versus populations, least-squares regression lines, correlation coefficients, compound dependent and independent probabilities, permutations, combinations, and geometric probability. Combine this resource with GeoGebra, Khan Academy and a solid online graphing calculator, then an AP Stats teacher has almost every concept covered for the AP Statistics exam.
5. EdHeads - A superior web tool for simulation software. The data AP Statistics students could collect from the simulations is vast. Although it would take one student quite a while to collect a significant set of data from one simulation, an entire class of students could run the same simulation and all achieve different yet similar results. This data could then be used for the AP Statistics inference unit. Can students collect and analyze the data from a sample set to make an inference about the entire population of data?
6. College Board - The College Board releases its AP free response questions every year. For less than the past decade, all questions have been posted online for free such that all students and teachers can access practice problems. All solutions are also included. Teachers and students using this internet resource for statistics exam practice problems can gain a better sense of what is expected of student responses during the exam in May.
7. Math is Fun - Another tutorial website that has an immense amount of lessons for statistics topics. Although the tutorials may not go into the topic of inference like Khan Academy does, it does have additional examples for just about all other stats topics. It also has lots of extra practice problems and doesn't immediately reveal the answers. Instead, the practice problems have students enter a solution first, then the website congratulates correct answers or discusses incorrect responses.
8. Random.org - An online random number generator every statistics teacher needs! The instructor or a student can even redesign the random number generator to
9. Statistical Applets - Created in conjunction with the textbook The Practice of Statistics by Darren Starnes, there are 17 applets that allow students to quickly generate results of simulated statistical scenarios. Instead of running a simulation by hand, students can have 100's, even 1000's of results fast. Like several of the other simulations mentioned in this list, this allows students to spend more time analyzing the data rather than collecting it. However, a good simulation also give the student the feel of collecting the data by experiencing how the data is collected, except super fast!!
10. YouTube - This is always an excellent resource to seek information about how-to-do something. Many topics about how to use any graphing calculator to achieve a certain statistics calculation can be found on YouTube as an instructional video. I find this resource invaluable as I learn to use the newer Nspire graphing calculator. Students can also use this if they have a calculator the instructor is not familiar with but they need the instructions on how to use it.
11. Meta-Calculator - This free online graphing calculator has specifically a superior statistics option. Also does regression analysis and t-Tests.
12. Mathway - Another free online graphing calculator with a stats option.
13. Google Spreadsheet - All statistics students need a way to collect and share data to analyze with their classmates.
14. Logger Pro - An alternative way to enter and graph data. In many ways easier to use than Excel for beginners. There is a simplified free version students can download from their website.
15. Rossman/Chance Applet Collection - More applet simulation options specifically for AP Statistics courses.
16. College Board Statistics Standards - AP Stats instructors must pay attention to these standards if they want their students to pass the AP exam and earn college credit.
17. Common Core State Standards for Statistics - This is the guideline teachers should use to prepare students for the probability and statistics portion of the newest state math exams.
18. National Council of Teachers of Mathematics - More statistics standards and tons of other resources available.
19. Ask Dr. Math - Have a question? This website has lots of answers.
20. Online Statistics Education - Designed by Rice University, providing many more tutorial options for stats.
21. Interactive Statistical Calculations - This page contains a huge compilation of additional interactive statistical websites.
AP Statistics Standards by The College Board
Adapted from The College Board Internet Resources
I . Exploring Data: Describing patterns and departures from patterns (20%–30%)
Exploratory analysis of data makes use of graphical and numerical techniques tostudy patterns and departures from patterns. Emphasis should be placed on interpreting information from graphical and numerical displays and summaries.
A . Constructing and interpreting graphical displays of distributions of univariate data (dotplot, stemplot, histogram, cumulative frequency plot)
1 . Center and spread
2 . Clusters and gaps
3 . Outliers and other unusual features
4 . Shape
B . Summarizing distributions of univariate data
1 . Measuring center: median, mean
2 . Measuring spread: range, interquartile range, standard deviation
3 . Measuring position: quartiles, percentiles, standardized scores (z-scores)
4 . Using boxplots
5 . The effect of changing units on summary measures
C . Comparing distributions of univariate data (dotplots, back-to-back stemplots, parallel boxplots)
1 . Comparing center and spread: within group, between group variation
2 . Comparing clusters and gaps
3 . Comparing outliers and other unusual features
4 . Comparing shapes
D . Exploring bivariate data
1 . Analyzing patterns in scatterplots
2 . Correlation and linearity
3 . Least-squares regression line
4 . Residual plots, outliers and influential points
5 . Transformations to achieve linearity: logarithmic and power transformations
E . Exploring categorical data
1 . Frequency tables and bar charts
2 . Marginal and joint frequencies for two-way tables
3 . Conditional relative frequencies and association
4 .Comparing distributions using bar charts
II . Sampling and Experimentation: Planning and conducting a study (10%–15%)
Data must be collected according to a well-developed plan if valid information on a conjecture is to be obtained. This plan includes clarifying the question and deciding upon a method of data collection and analysis.
A . Overview of methods of data collection
1 . Census
2 . Sample survey
3 . Experiment
4 . Observational study
B . Planning and conducting surveys
1 . Characteristics of a well-designed and well-conducted survey
2 . Populations, samples and random selection
3 . Sources of bias in sampling and surveys
4 . Sampling methods, including simple random sampling, stratified random sampling and cluster sampling
C . Planning and conducting experiments
1 . Characteristics of a well-designed and well-conducted experiment
2 . Treatments, control groups, experimental units, random assignments and replication
3 . Sources of bias and confounding, including placebo effect and blinding
4 . Completely randomized design
5 . Randomized block design, including matched pairs design
D . Generalizability of results and types of conclusions that can be drawn from observational studies, experiments and surveys
III . Anticipating Patterns: Exploring random phenomena using probability and simulation (20%–30%)
Probability is the tool used for anticipating what the distribution of data should look like under a given model.
A . Probability
1 . Interpreting probability, including long-run relative frequency interpretation
2 . “Law of Large Numbers” concept
3 . Addition rule, multiplication rule, conditional probability and independence
4 . Discrete random variables and their probability distributions, including binomial and geometric
5 . Simulation of random behavior and probability distributions
6 . Mean (expected value) and standard deviation of a random variable, and linear transformation of a random variable
B . Combining independent random variables
1 . Notion of independence versus dependence
2 . Mean and standard deviation for sums and differences of independent random variables
C . The normal distribution
1 . Properties of the normal distribution
2 . Using tables of the normal distribution
3 . The normal distribution as a model for measurements
D . Sampling distributions
1 . Sampling distribution of a sample proportion
2 . Sampling distribution of a sample mean
3 . Central Limit Theorem
4 . Sampling distribution of a difference between two independent sample proportions
5 . Sampling distribution of a difference between two independent sample means
6 . Simulation of sampling distributions
7 . t-distribution
8 . Chi-square distribution
IV . Statistical Inference: Estimating population parameters and testing hypotheses (30%–40%)
Statistical inference guides the selection of appropriate models.
A . Estimation (point estimators and confidence intervals)
1 . Estimating population parameters and margins of error
2 . Properties of point estimators, including unbiasedness and variability
3 . Logic of confidence intervals, meaning of confidence level and confidence intervals, and properties of confidence intervals
4 . Large sample confidence interval for a proportion
5 . Large sample confidence interval for a difference between two proportions
6 . Confidence interval for a mean
7 . Confidence interval for a difference between two means (unpaired and paired)
8 . Confidence interval for the slope of a least-squares regression line
B . Tests of significance
1 . Logic of significance testing, null and alternative hypotheses; p-values; one- and two-sided tests; concepts of Type I and Type II errors; concept of power
2 . Large sample test for a proportion
3 . Large sample test for a difference between two proportions
4 . Test for a mean
5 . Test for a difference between two means (unpaired and paired)
6 . Chi-square test for goodness of fit, homogeneity of proportions, and independence (one- and two-way tables)
7 . Test for the slope of a least-squares regression line
