Part 1: Video Library
The following videos were selected to help teachers understand the standards and enhance the teaching of probability and statistics in AP Statistics by integrating hypermedia into lesson plans.
|
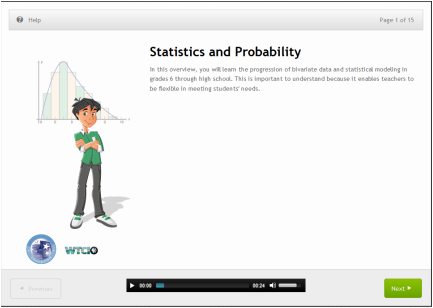
This video, from PBS Learning Media, explains the progression of probability and statistics in the common core state standards as students participate through grades 6-12. It is an excellent video to help teachers understand the progression that students will experience. This will assist teachers when preparing to teach AP Statistics. (Link to video as it does not embed.)
|
This video, published by National Teacher Training Institute, explains some of the relative advantages and why teachers should include videos as part of their lesson plans. (Link to video as it does not embed.)
|
|
|
|
This video from YouTube EDU helps teachers help students by explaining some critical multiple choice strategies for the AP Statistics exam.
|
This video, as shown on Khan Academy, introduces statistical correlation and causality. It will help students understand when to make conclusions.
|
|
This video, also created by Khan Academy, teaches students how to use Excel to analyze data. The video has data entered, shows students how to graph it, then shows how to fit a line to data.
|
This TEDEd video of Hans Rosling, shows statistics on a graph as a video. It would be an excellent introductory video to statistics in an AP Statistics course to demonstrate the importance of analyzing statistics in the real world.
|
|
|
|
|
This video from TeacherTube, although the recording is a bit loud and distorted, gives an excellent explanation of what a misleading graph is, why they are made and how to spot one. Excellent for both teachers and students, who are involved in AP Statistics courses, to view.
|
This video is from Google Tech Talks from Stanford's Statistics 202 course, Statistical Aspects of Data Mining. It is excellent for both students and teachers to see this video to gather a better understanding about the statistics being taught at the college level.
|
|
|
|
|
Found on SchoolTube through Jane's pick of the day, this video features Peter Donnelly who discusses how juries are fooled by statistics. It is a great example that shows teachers and students about the wide application of statistics in the real world. This is also a TEDtalk video.
|
Here is another video demonstrating the wide variety of contexts in which statistics can be used. Within this very well designed video, Dan Meyer demonstrates a large array of topics and their associated statistics from 2009. This was found through pcs-tech video resource list on Vimeo.com
Dan Meyer's 2009 Annual Report from Dan Meyer on Vimeo. |
Part 2: Video Enhanced Lesson Plan
Name
Angie Kruzich
Lesson Title
Finding Probabilities using Z-Scores in a Normal Distribution Model
Introduction
In this lesson students will be introduced to normally distributed data, the Empirical Rule, z-scores, and how to use a z-score table. Students will also learn how to find the probability or percentage of data that fall above, below or between specified z-scores given that the data is normally distributed. Students will need to be able to find these probabilities using three different techniques; using z-score table, using a graphing calculator and using an Excel spreadsheet.
Content Area
AP Statistics
Grade Level
High School Grades 10-12
Objectives
Student will be able to (SWBAT) recognize normally distributed data.
SWBAT standardize data into the form of a z-score.
SWBAT interpret the meaning of the Empirical Rule (68-95-99.7 Rule).
SWBAT examine data using the Empirical Rule.
SWBAT calculate the percentage of data above, below and between z-scores using a table, a calculator and an Excel spreadsheet.
Standards Addressed
From The College Board for AP Statistics
III. Anticipating Patterns - Exploring random phenomena using probability and simulation
Probability is the tool used for anticipating what the distribution of data should look like under a given model.
C. The normal distribution
1 . Properties of the normal distribution
2 . Using tables of the normal distribution
3 . The normal distribution as a model for measurement
From the State of Washington
S-ID Interpreting Categorical and Quantitative data
Summarize, represent, and interpret data on a single count or measurement variable
4. Use the mean and standard deviation of a data set to fit it to a normal distribution and to estimate population percentages. Recognize that there are data sets for which such a procedure is not appropriate. Use calculators, spreadsheets, and tables to estimate areas under the normal curve
From 21st Century Skills
Information and communication technology (ITC) literacy, media and internet literacy, visual interpretation, data interpretation and analysis, computer programming.
Relative Advantage
Students will be exposed to both the technological and paper/pencil techniques to calculate the probability area under a Normal Density Curve given a certain z-score or an interval of z-scores. Many students begin to struggle at this point in the course, so by providing additional video resources, students can have a lesson retaught to themselves via video. This provides a substantial advantage for students as they can now pause the lesson as necessary, repeat the video when needed, skip portions of the lesson they may already understand and access the lesson when ever and where ever they have internet access.
Timeline
4-7 hours of class time and/or out of class time
Materials
Each student will need the following supplies:
Paper, pencil and a graphing calculator
A computer with access to Excel, PowerPoint, internet and the ability to view videos.
Z-Score Probability Table
Introductory PowerPoint
Introductory Video to Normal Distribution and the Empirical Rule
Instructional Video to calculate z-scores
Instructional Video to determine probabilities for areas below, above and between specified z-scores using a table
Instructional Video to determine probabilities using a TI-83 or TI-84 graphing calculator
Instructional Video to determine probabilities using an Nspire graphing calculator
Instructional Video to determine probabilities an excel spreadsheet
Small Group Activity Handout
Individual Exit Ticket for Group Activity
Extra individual practice examples for students: using Empirical Rule, calculating z-scores, and more of both.
Grouping Strategies
Initially, the material will be presented to the whole group. One presentation computer is needed. Next, in small groups of 3-5 students (randomly selected in stats class of course), they will be assigned a task to complete using this new information. For this portion of the learning process, each student will need a z-score table, a graphing calculator and a computer with access to excel, the internet and the ability to watch videos. Finally, students will try to apply the new information on their own outside of the classroom. Likewise, when the students are working independently, any video lesson can be accessed for additional instruction. Individual student results can be discussed as a whole class during a future class period.
Learning Activities
Again, this lesson begins as a whole class discussion. Introduce the material using the provided PowerPoint and video selections as listed under materials. Next, during the small group phase, the group is to complete the small group activity handout. During this time, students can access any of the instructional videos to review and receive additional assistance as necessary to complete the activity's calculations. You could provide one computer per person or if computer access is limited groups can share one or two computers. Once the group has completed the questions in the activity and their exit tickets, the group findings are reported to the teacher. The next phase of this lesson involves individual practice. This can be completed in class or outside of class as a homework assignment. Finally, wrap up the conclusion of the lesson during a future class period using a whole class discussion to check for student understanding. Have a class discussion about the extra individual practice examples. Are there still questions? Do students have a strong understanding behind the idea of a normal distribution, z-score, standardizing data and finding general percentages of data that will lie in a particular range? At a future date, follow up with a quiz on the topic.
Assessment
Students will be assessed at three different levels. First, students will have a formative assessment in the form of homework. This is not graded for accuracy, but just for completion. Students may ask questions and make corrections to their work. A second level of assessment is summative, in the form of a quiz. This will be graded for accuracy. The quiz will only be made up of questions about probability within a specified z-score interval. The third assessment will be on a midterm. The midterm in this course should be made up of AP type questions. It should be cumulative but only consist of questions covered so far in the course.
Adaptations for Learners with Special Needs
A video enhanced lesson automatically begins the process of a modified lesson plan to meet the needs of ELL students and those with physical and learning disabilities. Video lessons provide students with multiple methods to obtain the information. Video examples can be presented in other languages. Videos can always be paused, repeated, portions skipped if no longer needed and accessed where ever and when ever necessary. Additional practice can be provided using interactive software. For those students with visual or auditory impairments, there is adaptive software that can modify the video for them.
References
College Board (2010). AP statistics course description. Retrieved from http://media.collegeboard.com/digitalServices /pdf/ap/ap-statistics-course-description.pdf
Office of the Superintendent of the State of Washington (2014). Common core state standards for mathematics: Mathematics | high school statistics and probability. (p.79-83). Retrieved from http://www.k12.wa.us/CoreStandards/Mathematics/pubdocs/CCSSI_MathStandards.pdf
Partnership for 21st Century Skills (2011). Framework for 21st century learning. Retrieved from http://www.p21.org/storage/documents/1.__p21_framework_2-pager.pdf
Roblyer, M. D. & Doerling, A. H. (2013). Integrating educational technology into teaching (6th ed.) (p.10-51). Upper Saddle River, NJ: Pearson.
Starnes, D., Yates, D., & Moore, D. (2011). The practice of statistics. New York, New York: W.H. Freeman and Company.
